Real-time Job Scheduling Dashboard
Maximize job visibility with vivid automation dashboards.
How can you benefit from a job scheduling dashboard?
Businesses have complex and dynamic IT environments with job schedules that have many different dependencies, prerequisites, and are run at various times. With JAMS, get a complete picture of your jobs for the assurance that your schedule will run smoothly—and the ability to troubleshoot issues fast. Watch this helpful video to learn how to create customized dashboards for your unique automation requirements.
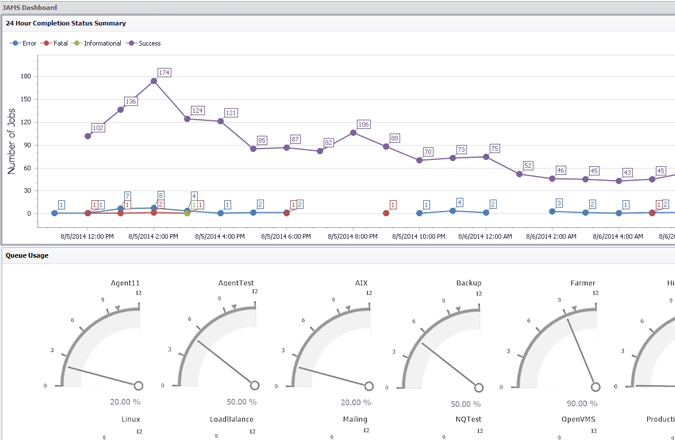
Primary Process Monitoring Dashboard
A clean, high-level view of your centralized schedule in two panels. The Primary Dashboard’s point and line series chart plots the completion status of every job that has run in the past 24 hours. Its lower panel, Queue Usage, displays gauges that specify the number of slots available in each queue.
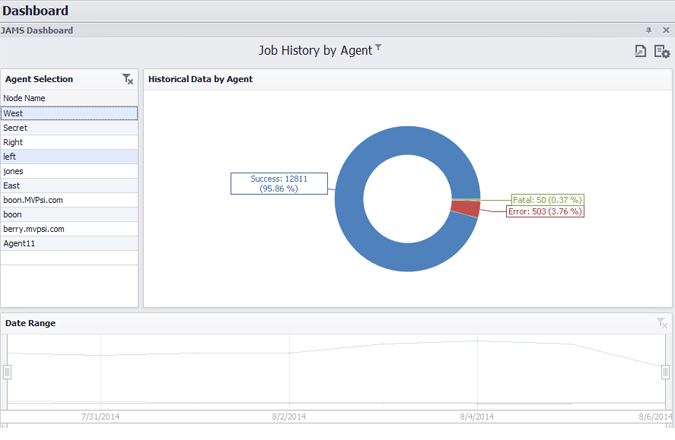
Job History by Agent
What’s the success rate of each agent machine you depend on to run scheduled tasks? The Job History by Agent dashboard lets you browse through job completion status summaries for each agent connected to the scheduler. An easy-to-read pie graph shows the proportions and counts of successful, informational, error and fatal completion statuses for jobs on each agent. Adjust the range filter to focus on job counts for specific time ranges.
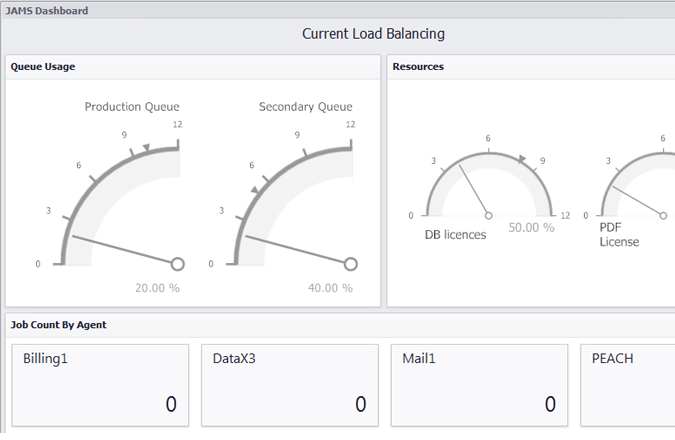
Current Load Balancing
The Current Load Balancing dashboard shows you at a glance what’s happening on an agent in real-time – the job count, the number of jobs in each queue and the resources being consumed. Get real-time feedback on changes to your scheduled tasks.
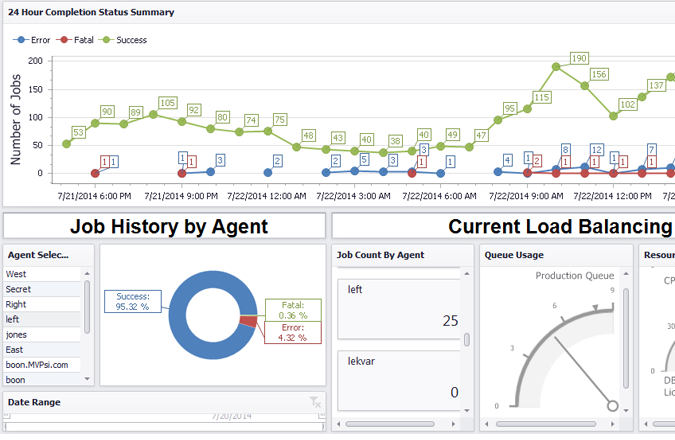
Advanced
We combined items from the three dashboards above into a comprehensive job management dashboard that provide you with a 20,000 foot view of your centralized batch schedule and all the agents connected to it. Right below the 24 Hour Completion Status Summary, the Job History by Agent chart and Current Load Balancing gauges provide detailed snapshots of performance metrics.
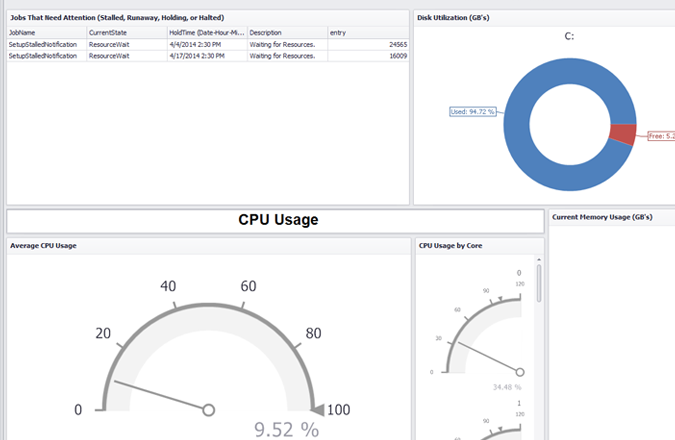
PowerShell
Take a deep dive into the performance metrics of the JAMS client. Disk utilization, CPU usage (by average and by core), current memory usage statistics, and more, are neatly displayed in pie charts, gauges and data tables. If you can query it in PowerShell, this dashboard can provide you with clear visualizations of the data.
Ready for more?
JAMS process monitoring dashboards are completely customizable. Each item’s settings can be modified to draw from a different data source, filter data, or use any of a wide variety of chat types. With the Dashboard Designer, you can start with a blank page and specify each and every detail of your custom dashboard.

Customers rate JAMS a High Performer
Top-notch, thorough, friendly, and responsive — these are just a few words used to describe JAMS Support.
JAMS enables efficient workload management and provides an unparalleled customer support experience. Rely on JAMS for expert help, whenever you need it.