The Dashboard presents a graphical summary of information and trends within the JAMS environment. Starting with version 6.2, JAMS provides a primary and other built-in Dashboards from which to choose.
In addition, JAMS comes with a set of preinstalled Dashboards that you can set up as an addition to or a replacement for the primary Dashboard. These other Dashboards include:
- The Advanced Dashboard
- Completion History by Agent Dashboard
- Current Load Balancing Dashboard
- Job History by Agent Dashboard
- PowerShell Dashboard
JAMS also includes a powerful designer tool to allow you to create custom Dashboards that track specific information unique to your organization.
The Primary Dashboard
The primary Dashboard (dashboard.jbd) provides summary information on the current queue usage along with a detailed 24 hour Job history.
To open the Dashboard, click on the Dashboard Shortcut. The primary Dashboard is divided into multiple panels that are described in more detail below.

24 Hour Completion Status Summary Panel
This Dashboard panel includes a graphic display of Job completed over the past 24 hours. All Jobs are broken out using JAMS completion status categories: fatal, warning, error, informational, success.
The 24 hour graph is interactive. For example, when clicking on a data point, the graph zooms in from its normal 24-hour range to focus on Jobs executed within the selected hour. To zoom out, either right-click on the panel and select the Drill Up command or click the Drill Up icon.
Queue Usage Panel
In addition, JAMS comes with a set of preinstalled Dashboards that you can set up as an addition to or a replacement for the primary Dashboard.
Setting up a Preinstalled Dashboard as a Default
To display the other Dashboards, you first need to open the Dashboard shortcut to alter its view settings as described below or create a new custom shortcut.
- To begin, right-click on the Dashboard Shortcut to view its context menu and select Properties to open the Shortcut Properties dialog.
- On the Views section, click the properties icon, shown in red.

- The View Properties dialog opens.
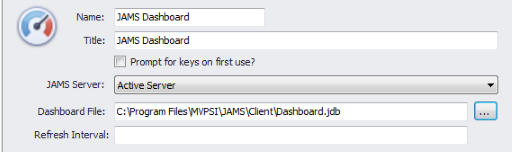
- Click the File Browser button to the right of the Dashboard File field to view the other preinstalled Dashboards (all come with .jdb extensions). Choose an alternative to the primary (Dashboard.jdb) and click the Open button.
 |
Note: All preinstalled Dashboard (.jdb) files are located in the JAMS installation directory (MVPSI/JAMS/Client). |
- Click OK to close the View Properties dialog.
- Choose the OK button to close the Shortcut Properties Dialog.
- The selected Dashboard displays and becomes the default whenever you open JAMS.
|
Note: The Dashboard title bar appears on some preinstalled Dashboards and is disabled on the primary Dashboard. To change this setting refer to the Master Filter section of the Custom Dashboards topic. |
The Advanced Dashboard
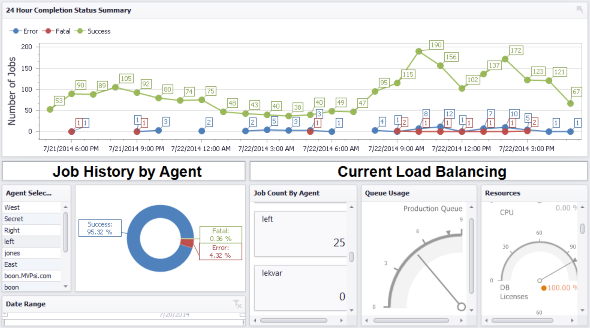
The Advanced Dashboard (AdvancedDashboard.jdb) includes a dynamic display of jobs run over the past 24 hours. All Jobs are broken out using JAMS completion status categories: fatal, warning, error, informational, success.
The Job History by Agent panel displays all Job history over the previous 7 days grouped by agent. You can dynamically filter. The Dashboard, as shown below, uses the Master Filter to control what data is displayed in the donut graph panel. The graph is linked or bound to the Agent Selection and Date Range items. Making changes to either element (e.g., highlighting one or more agents or changing the date range slider), immediately updates the graph to reflect the changing source data.
The Current Load Balancing panel is divided into three subpanels that can provide a picture of the overall health of your JAMS environment.
- Job Count by Agent subpanel allows user to select one or more agents to view how many Jobs are running using that agent.
- Queue Usage subpanel displays all queues, available usage capacity as well as their current utilization rate.
- Resources subpanel presents Resource load availability within the JAMS environment.
Completion History by Agent Dashboard
This Dashboard (CompletionHistoryByAgent.jdb) includes a Job History filtered by Agent name and final severity.
For example, selecting one or more agent names and clicking on chart’s bar elements (or key icons) refreshes the two graphs.


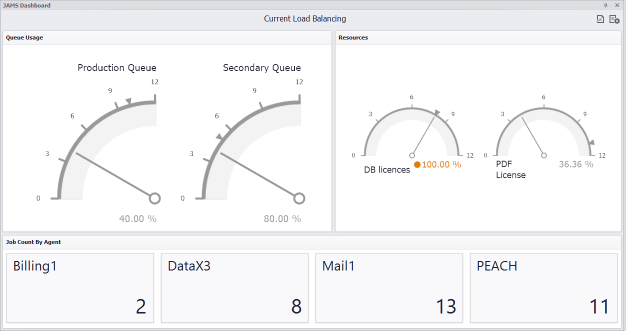
Current Load Balancing Dashboard
The Current Load Balancing Dashboard (CurrentLoadBalancing.jdb) is divided into three panels. All the accompanying graphs in this Dashboard also appear in the Advanced Dashboard.
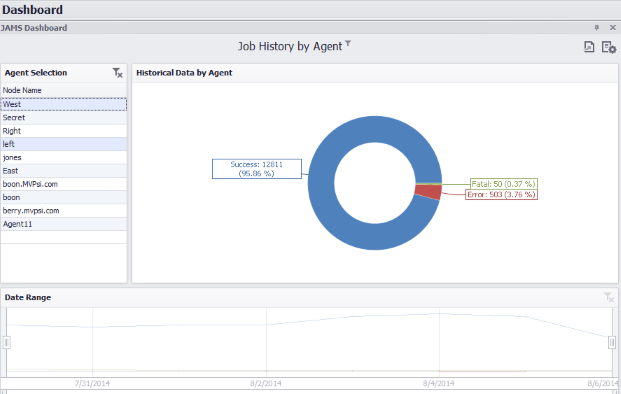
Job History by Agent Dashboard
This Dashboard (HistoryByAgent.jdb) graphically displays all Job history over the previous 7 days grouped by agent. You can filter the data being displayed by selecting the agent name to view its individual history.
The Date Range subpanel can display Job History data within the last 7 days. For example if you only wanted to view Job History for the previous 3 days history you could move the range selector to the correct date.
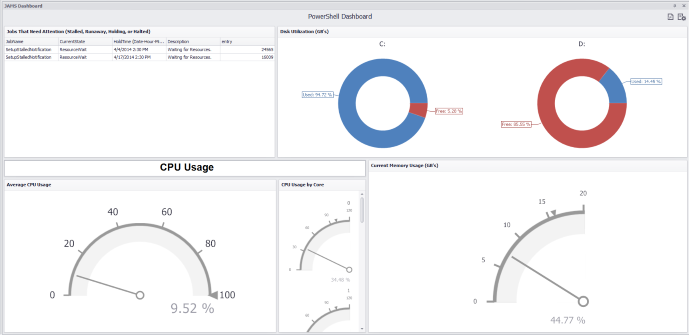
PowerShell Dashboard
This Dashboard (ServerResources.jdb) provides extensive data about the machine hosting the JAMS Client. This multi-panel displays combines data on Disk Utilization, CPU Usage (broken down by average and Core) along with current Memory usage. The Dashboard also includes a panel listing of all Jobs requiring user attention (e.g., stalled, runaway, holding, or halted).
Additional Dashboard Elements
Parameters
 Parameters pass information to various Dashboard Items or data sources allowing you to quickly alter the Dashboard’s display. For example, the Advanced Dashboard contains 3 default parameters to define what agents, queues and resources to display in the Current Load Balancing panel. Click the parameters button (icon with document and gears) to access the Dashboard Parameters control window.
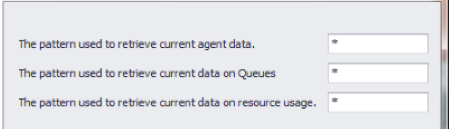
Some Dashboard Parameters use wildcard expressions. For example, in the Advanced Dashboard, if you wanted to show specific information about current agents with “production” in their name, enter *production* in the agent data parameter.
The Dashboard is not limited to these three parameters. You can add and customize additional parameters to change what is displayed on the primary and preinstalled dashboards and create custom Dashboards.
Exporting Dashboard Items
You can export the Dashboard by clicking on the Export To button, which is located to the left of the Parameters button. The export function allows you to print a snapshot of your Dashboard, control its resolution, and save it as an image (png, jpeg, or gif) or a pdf.
|
Note: Some preinstalled Dashboards include Parameter settings, while others, such as the Primary Dashboard, do not. |