JAMS includes a variety of preinstalled Dashboards that are intended meet most user needs. In fact, it’s probably a good idea to start using these Dashboards to get a better understanding what kinds of data are important and what could potentially be added to enhance their usefulness.
JAMS comes with powerful design features to modify or completely alter a Dashboard to fit the way you use JAMS. Custom Dashboards can incorporate a variety of data sources including: JAMS specific data, PowerShell scripts, plus data stored in external databases, such as Microsoft SQL Server, MySQL, and Microsoft Access.
There are three key steps to setting up and building a custom Dashboard:
- Defining a Data Source (using JAMS or external data sources).
- Setting up a Dashboard Item (determining the Dashboard's functionality and formatting.
- A third, optional step can include adding or modifying Parameters, setting up drill downs, filtering functionality.
- The last step is to add a custom Dashboard Shortcut.
Follow the steps below to build your own custom Dashboard using JAMS' powerful Dashboard Designer feature.
The process of setting up a custom Dashboard begins by opening the Dashboard Designer and locating and defining a Data Source. Custom Dashboards can incorporate a variety of data sources that can be used to build simple or complex Dashboards.
To get started, select the Dashboard icon on the JAMS Ribbon Bar to open the Dashboard Designer.
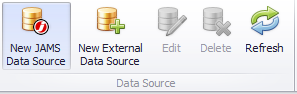
- Select the Dashboard Designer’s Data Source tab and choose the New JAMS Data Source button located on the far left of the Ribbon.
- The Save Dashboard File dialog opens. Enter a name for the Dashboard file (.jdb) and click Save.
- The Add a Dashboard Data Source Wizard opens. On the first page, enter a Data Source Name and use the pull down to select a Data Source Type (as described below). Click the Next button.
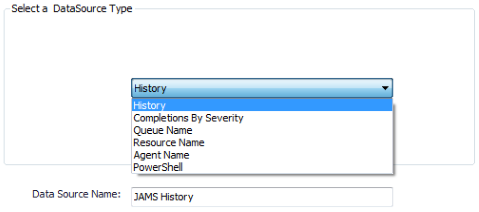
JAMS Data Source Types
- History: provides JAMS history query that returns all JAMS Job properties matching a specific criteria and time frame.
- Completions By Severity: includes an optimized version of the History data source that only returns completion count data. This is the preferred choice when retrieving historical data for a large number of Jobs.
- Queue Name: contains all the properties from your JAMS Queues.
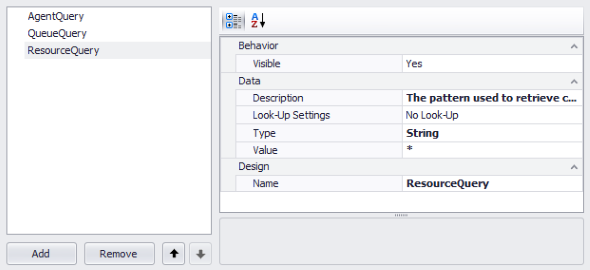
- Resource Name: includes all the information about each JAMS Resource, including usage data.
- Resource Name incorporates comprehensive information about each JAMS Resource, including usage data.
- Agent Name: provides comprehensive information for all installed JAMS Agents.
- PowerShell: runs a PowerShell script. The returned PowerShell objects are accessible to all Dashboard items.
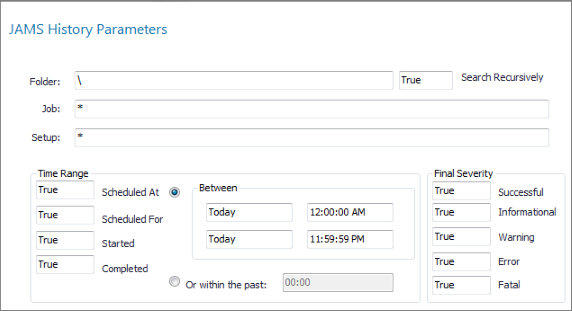
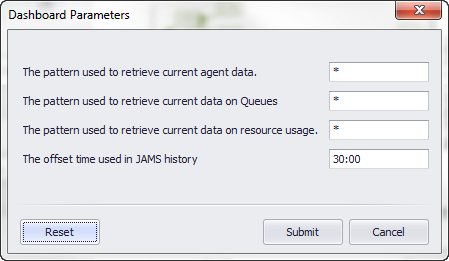
- The Parameters Wizard page opens. Enter the desired parameters. For example, if the History type is chosen, enter specific properties or use the wildcard expressions (as shown below) and click the Finish button.
Using External Data Sources
You can also insert other non-JAMS data sources such as a database or XML files. To add an external data source, follow these steps:
- On the Dashboard Designer, select the Data Source tab.
- Select the New External Data Source button. Please note: this is different than the New JAMS Data Source button used in the previous section.
- The Create Data Source wizard opens. On the first page, enter a name for your preferred data source. Click the Next button.
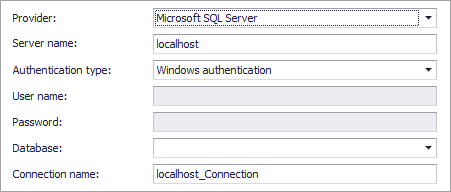
- The connection parameters page opens. Select a Provider from the drop down list. Depending on your selection specify what data to acquire from the provider. Click the Next button.
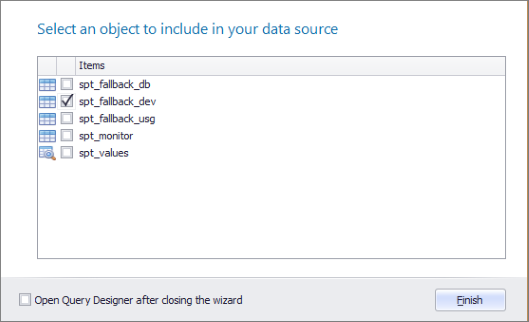
- After entering the desired options, click Finish to display the external data source on the Dashboard.
Once a Data Source has been defined the next step is to set up the Dashboard item(s).
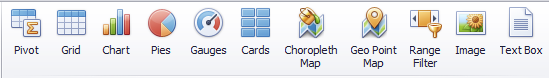
- Begin this step by opening the Designer’s Home tab and select a Dashboard Item type on the Ribbon.
- This action opens the Dashboard Elements page made up of three contiguous sections: Data Source Browser, Data Items Pane and Preview Pane. This is the display where you link (or bind) the data source created in the first step with the new Dashboard Item.
- On the top of the Data Source Browser select an existing Data Source from the drop down menu.
- As shown below, the selected Data Source opens displaying all associated Data Fields.
- Drag the desired Data Field from the Data Source Browser and drop it onto the appropriate container field on the Data Items pane.
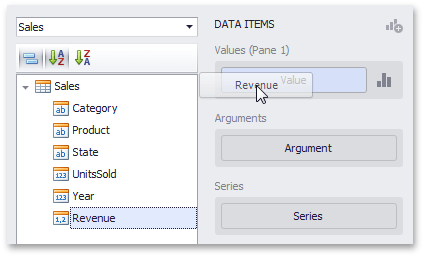
 |
Note: you can also remove the data item by dragging it outside the Data Items pane. |
- Use the Preview Pane to confirm each selection.
|
Note: you can quickly change the Dashboard type by right-clicking in the Preview pane. This action opens the Dashboard context menu. Select the Convert To command submenu to view a listing of Dashboard types (e.g., Pivot, Grid, Chart, Pies, etc.) |
-
You can insert additional Dashboard items by selecting another Dashboard type on the Designer’s Home tab ribbon.
|
Note: you can only use one Data Source per Dashboard Item. |
-
As shown in step 3, open an existing Data Source from the Data Source Dropdown menu and drag and drop the desired Data Fields to the appropriate section on the Data Item Pane.
-
From the Design tab use the available tools to customize the new Dashboard item.
.png)

-
Click Save to complete the two-step Dashboard design process.

Parameters pass information to Dashboard Items allowing you to alter what is displayed without having to make changes from within the Dashboard Designer.
Changing an Existing Parameter
To access the parameters settings click the Parameters button (icon with document and gears located on the top right portion of the Dashboard window). This action opens the Parameters dialog.

Creating New Parameters
You can define new parameters within a Dashboard to further customize its display.
To add a parameter(s) to a Dashboard, open the Dashboard Designer.
-
On the Dashboard Designer’s Home tab click Open and navigate to the desired Dashboard (.jdb) file, typically located in the JAMS Installation directory (MVPSI/JAMS/Client).
-
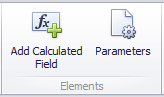
Select the Designer's Data Source tab and choose the Parameters button.
-
The Parameters Properties dialog opens. On the left panel select an existing parameter to modify its properties.
- Or click the Add button to define a new parameter.
- On the right panel define the properties for the selected parameter.
- Click the OK button when completed.
Using the New Parameter
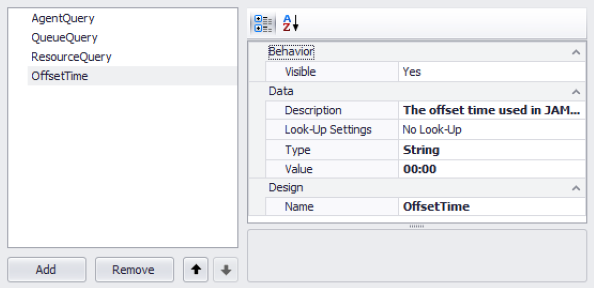
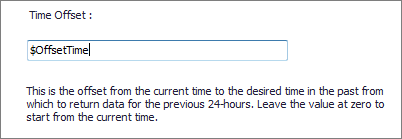
The value of Dashboard parameters can be used for any JAMS Data Source Parameter. This is done using the syntax $parameterName. For example, if you had a parameter called OffsetTime you would reference the Dashboard parameter in a JAMS Completion by Severity data source by entering $OffsetTime into the wizard instead of hard coding a number into the Time Offset field.
The Dashboard Designer includes a drill down function to help you create a more dynamic display with multiple levels of information.
The example below shows how selecting a single node on 24 hour line graph zooms the information view to a particular hour.

To create a drill down effect you must define multiple related data sets in the Arguments container field located on the Data Items pane. The Dashboard’s highest level data is entered on the first Data Item Container field and the “drill down” data is defined on the second.
|
Note: If three or more drill-down levels are needed, additional containers fields will appear on the Data Items pane. |
A Drill Down Example in 3 Steps
Use the following example to create a pie chart that displays JAMS Jobs that have executed over the past 24 hours by severity levels (e.g., Success, Warning, Error, Fatal and Informational).
Step 1: Set up the Custom Dashboard Item
To get started with this example, first create a Data Source.
- From the JAMS Ribbon, open the Dashboard Designer.
- On the Data Source tab select the New JAMS Data Source button located on the left end of the Ribbon.
- The Add Dashboard File dialog opens.
- On the first wizard page enter a Data Source Name. For this example, name it JAMS History and use the pull down menu to select a Data Source Type. Choose the History option, which tells JAMS to provide information on previously run Jobs. Select the Next button.
- On the Parameters page, keep the default settings and click the Finish button
Step 2: Add a Custom Dashboard Item
- From the Dashboard Designer, select the Home tab. On the Ribbon, choose the Pies option.
-
This action opens the Dashboard Elements page. This is where you bind specific Data Items to create the pie chart.
-
From the Data Source Browser, use the pull-down menu to select the JAMS History Data Source you defined in step 4. This action displays all Data Fields associated with the data source.

-
On the Data Source Browser drag and drop the specific Data Fields to the appropriate Data Item Containers on the Data Items pane, as described below.
-
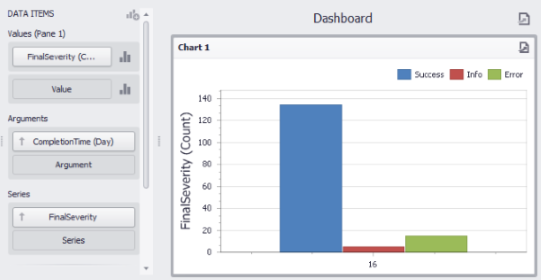
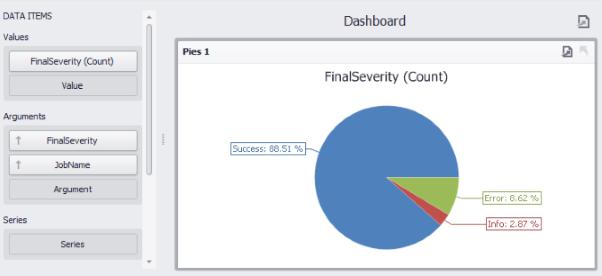
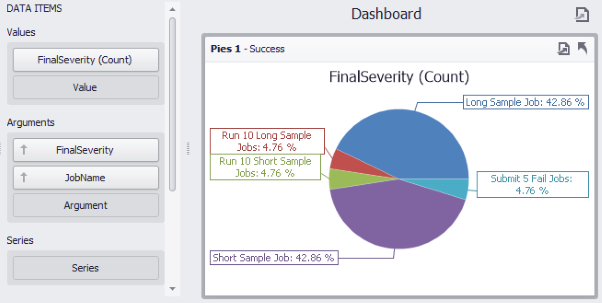
Find and then drag the FinalSeverity Data Field to the first Values Data Item Container.
-
Second, drag the same FinalSeverity item again, this time to the first Arguments container field. These data items will appear in the top level display as shown in the preview window below.
-
To add the data item for the drill down view, drag the JobName data item to the second Argument container.
Step 3: Define and Setup the Drill down Property
-
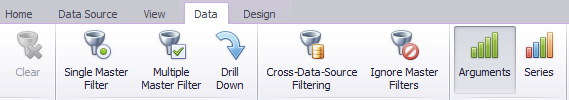
On the Dashboard Designer select the Data tab.
-
Activate the Arguments button. By enabling the Arguments option the Dashboard item treats the two arguments as distinct, but related data sets.
-
Click to activate (highlight) the Drill Down button. This allow the Dashboard Designer to interpret different sets of data between the two Arguments data item containers.
- On the Preview pane, test the drill down by clicking on the Success portion of the pie chart. This actions should now detail all successful Jobs executed during the past 24 hours.
- To move back to the first level pie chart display, right-click on the chart to display the Drill up context menu or alternatively choose the curved arrow Drill up icon.

- Select the other elements of the pie chart to test the drill down function.
- Optionally, open the Design tab to take advantage of the built-in formatting tools.
- Choose the Save button to complete the custom Dashboard.
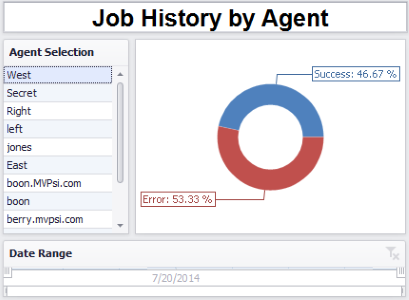
The Master Filter is a Dashboard Designer feature that allows you to choose what data is displayed on a Dashboard Item. For example, when Master Filtering is enabled you can click a specific Dashboard Item to trigger updates to other items (chart, pies, gauges, etc.).
The Dashboard example below uses the Master Filter to control what data is displayed in the donut graph in the Preview panel. In this case, the donut graph is linked to the Agent Selection and Date Range items. Making changes to either element (e.g., highlighting one or more agents or changing the date range slider), immediately updates the graph to reflect the changing input data.
Using Master Filter Modes
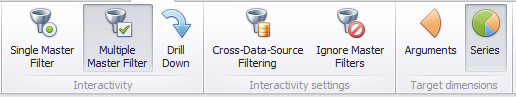
For each Dashboard Item, the Master Filter supports two selection modes: Multiple and Single.
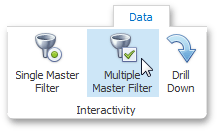
Multiple Master Filter Mode
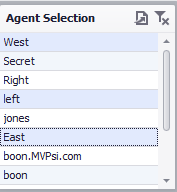
This mode allows you to select multiple elements within a Dashboard subpanel. For example, when choosing the Agent Selection subpanel with the Multiple Master Filter enabled you can Control + click to highlight multiple agents as shown in the two screenshots below.
Single Master Filter Mode
Unlike the Multiple Master Filter, the Single Master Filter mode only allows you to select one element at a time within a selected Dashboard subpanel.
Ignoring the Master Filter
Dashboard items can be set to ignore the Master Filter entirely. To do this, choose a Dashboard Item and select the Ignore Master Filters button located on the Dashboard Designer’s Data tab.
For example, the Agent Selection sub panel, shown above, is set to ignore the master filter because it is the primary setting for that subpanel. In other words, you input an agent selection in order to update the donut graph, not the other way around.
Enabling the Master Filter
As described above, there are several Master Filter modes and settings, but there is no one place where you can actually view all these settings. Instead, each individual Dashboard Item must be selected within the Designer to view the Master Filter settings.
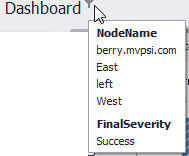
However, you can view the Master Filter state by hovering over the filter icon adjacent to the Dashboard title. This filter icon only appears when there is more than one criteria affecting the filter.
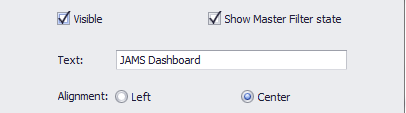
The Dashboard Title is turned off by default on the primary Dashboard. To change this settings open the Designer and select the Home tab. On the far right side of the Ribbon select the Title button. On the Dashboard Title dialog, activate the Visible and Show Master Filter state checkboxes.
Finally, to make changes to a Dashboard’s Master Filter settings, open the Dashboard Designer.
-
On the Designer’s Home tab click the Open button.
-
Navigate to and select the desired Dashboard (.jdb) file.
-
This opens the multi-panel Dashboard Elements page.
-
Select the Data tab to view what, if any, Master Filter buttons are activated.
-
On the Preview pane, select a subpanel. Notice how the Data Item Container fields are updated to reflect the subpanel’s settings. This is where you define or modify how each Dashboard Item affects the Master Filter.
Finally, you will need to create a Shortcut that links to the completed Dashboard. Every custom Dashboard generates a .jdb and preference file. To access a Dashboard in the JAMS Client you must define a shortcut that points to the desired .jdb file as described below.
-
From the Shortcut Bar’s Control group right-click to display the context menu and choose the Add Shortcut command.
-
The Add a Shortcut wizard opens. On the first page, select a Dashboard icon from the dropdown list, enter a name, title (the Dashboard’s display page title) and description for the shortcut. Choose the Next button.
-
Select the Dashboard options from the View list. Click the Next button.
-
On the properties page, set the shortcut properties for the View by populating the name and title fields. Locate the specific Dashboard by selecting a server or maintain the Active Server default option. Use the File Browser button to navigate to the specific .jdb file. Click Next.
|
Note: You should also check for a preference (.pref) file with the same name as the Dashboard located in that folder. If this preference file is not in the same folder as the jdb file the Dashboard won’t function properly. |
-
Specify a Refresh Interval, which is the amount of time between automatic updates to the Data Source. Use the format: Days.Hours:Minutes:Seconds; e.g., 0.2:30 (refreshes every 2 hours and 30 minutes. Leaving any element blank defaults to 0). Click Next.
|
Note: if the Refresh Interval field remains empty or is set to 0 the Dashboard cannot automatically refresh. Alternatively, you can manually initiate a refresh by clicking the Refresh button on the JAMS Ribbon. |
- Finally, click Finish or select the Add Another View button to include additional Views for the Shortcut. As shown below, the new Dashboard link should appear in the Shortcut Bar's Control group.